La Niña 2017: what are the impacts on East African weather?
For agricultural practices it is very convenient to be able to anticipate on the coming seasons’ weather. Especially in Africa, where most of agriculture is rain-fed, it is very helpful to know in advance if it will be a relatively wet or dry season, so farmers can choose the optimal crop or variety. Forecasting the weather on seasonal timescales is more difficult than forecasting the next few days. One of the reasons for this is that seasonal patterns depend on the status of the global climate system, including the oceans. An example of a well-known seasonal pattern is the El Niño phenomenon. El Niño is an event of unusual warming of the Equatorial Eastern Pacific Ocean in December and it has effects on the weather around the globe, especially on rainfall patterns in the tropics. El Niño is the warm phase of a larger phenomenon called the El Niño Southern Oscillation (ENSO). The opposite of El Niño is called a La Niña, which describes a cooling in the Equatorial Pacific Ocean.
In 2015 we have seen a big El Niño event, that affected agricultural production in many places in the world. The system is now reverting to a La Niña. In figure 1 we are looking at seasonal (long range) forecasts for sea surface temperature made by the European Centre for Medium Range Weather Forecasting (ECMWF). All the ensemble members of the model (red lines) are negative, indicating that a solid La Niña is forecasted the coming half year. Unfortunately the models did not predict this La Niña well ahead; half a year ago they even had a tendency of predicting another El Niño this year. The situation demonstrates how difficult it still is to predict the occurrence of El Niño long in advance.
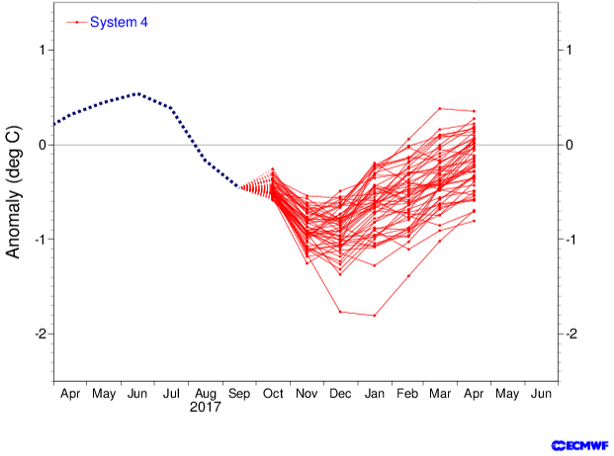
Figure 1: El-Niño forecast of an ‘ensemble’ of models for the coming months in red, observations in the black dotted line. Negative values indicate La Niña. The figure is created by the ECMWF and can be downloaded here.
The current rainfall patterns show that in most parts of Eastern Africa, the rainfall season of summer and autumn 2017 was not as dry as in 2015 and 2016. Figure 2 shows the Standardised Precipitation Index for rainfall in the last 90 days, based on CHIRPS rainfall data. Blue colours indicate above average rainfall. Note the enhanced rainfall in Western East Africa and large parts of Ethiopia, that is likely to result in improved yields for most of farmers rains in Kenya, Uganda, Ethiopia. Other countries (especially Somalia and Eastern Democratic Republic of Congo) experienced reduced rainfall and a poorly performing season.
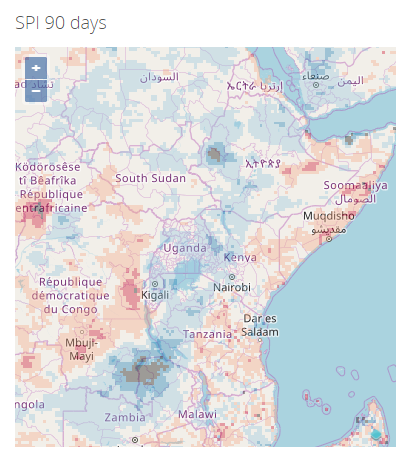
Figure 2: Standardised Precipitation Values of 90 days accumulated rainfall over Eastern Africa on 20th October 2017. Blue colours indicate above-average rainfall. This figure is created by Weather Impact based on CHIRPS data.
What is the expected rainfall for the coming months in East Africa and do we see an effect of the forecasted La Niña?
Historically, La Niña correlates with below-average rainfall in the months December to February in parts of Eastern Africa, whereas Southern Africa is wetter and cooler than normal. The seasonal precipitation forecasts of ECMWF for the next three months (November, December, January) are shown in Figure 3. Yellow and brown colors indicate that it is more likely to be a dry season than a wet season, whereas the green colors indicate that it will be more likely a wet season than a dry season. The forecasts show above-average rainfall over Tanzania, Malawi, Mozambique and Madagascar and not a clear defined ‘dryer than normal’ area; a little different for the historically known fingerprint of La Niña. Note that the figure only shows the most likely scenario for this year.
Time will learn if these scenarios were right. It is our goal to explain the remaining uncertainties as good as possible to the stakeholders of reliable weather forecasts, among which farmers, to support optimal decision making in the agricultural sector.
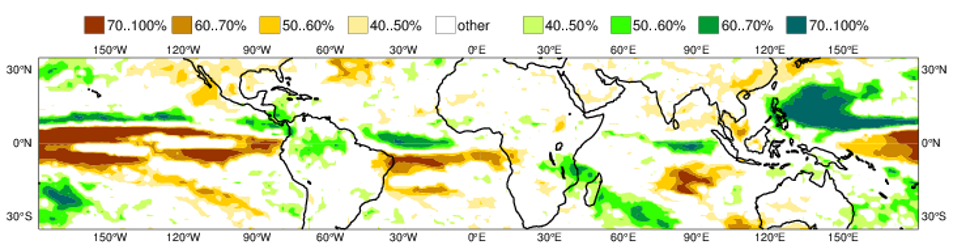
Figure 3: ECMWF seasonal forecast for rainfall in the months October, November, December. The colors indicate the probability of the most likely category of precipitation. The figure is created by the ECMWF and can be downloaded here.